首页
课程
问答
CTF
社区
招聘
峰会
发现
排行榜
知识库
工具下载
看雪20年
看雪商城
证书查询
登录
注册
首页
社区
课程
招聘
发现
问答
CTF
排行榜
知识库
工具下载
峰会
看雪商城
证书查询
社区
逆向工程
发新帖
1
3
[原创]ACE反作弊 MVM 的分析与还原
发表于: 14小时前
548
[原创]ACE反作弊 MVM 的分析与还原
AE__
1
14小时前
548
## 0x00 前言 前段时间分析一份 Android 侧反作弊样本,其中相当一部分逻辑并没有直接以 ARM64 native code 的形式存在,而是被放到了一套自定义虚拟机中执行。 最开始手里的主要文件是: ```text libanogs.so mrpcs_a_v.data ``` 实际执行 VM 的 native 函数位于: ```text sub_3F80CC ``` 这个函数外面套了比较重的 OLLVM Control Flow Flattening。直接 F5 后基本只能看到大量状态计算、间接跳转和被切碎的 basic block。 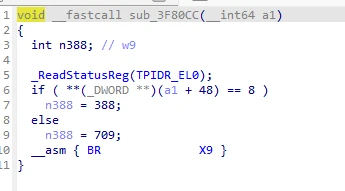 `mrpcs_a_v.data` 本身也不是裸 VM bytecode,外层首先是 ZIP,内部又有自己的 VMRPCS 格式。 所以一开始面对的是: ```text ZIP ↓ 未知编码 ↓ VMRPCS ↓ 未知 section ↓ VM bytecode ↓ 未知 opcode ↓ OLLVM VM interpreter ``` 最初我只是想把 `sub_3F80CC` 看明白。 最后实际做成了: ```text MRPCS / VMRPCS ↓ Parser ↓ VM Decoder ↓ Disassembler ↓ Clean VM Emulator ↓ Function Discovery ↓ CFG / IR ↓ SSA / Type Recovery ↓ C-like Decompiler ``` 本文主要记录这套 MVM 从文件格式、解释器到静态反编译器的还原过程。 --- # 0x01 VMRPCS 外层 `mrpcs_a_v.data` 外层是一个 ZIP。 解包以后只有: ```text unzipmrpcs.data ``` 大小: ```text 227488 bytes 0x378A0 ``` 文件开头类似: ```text f8 8d 24 4d 2c 37 28 2a 39 29 ... ``` 沿上层 loader 往下跟,可以得到: ```text key = payload[1] + payload[3] = 0x8D + 0x4D = 0xDA ``` 结合 payload 长度低字节: ```text len8 = 0x378A0 & 0xFF = 0xA0 ``` 对头部几个字节处理: ```text 2C ^ DA ^ A0 = 56 'V' 37 ^ DA ^ A0 = 4D 'M' 28 ^ DA ^ A0 = 52 'R' 2A ^ DA ^ A0 = 50 'P' 39 ^ DA ^ A0 = 43 'C' 29 ^ DA ^ A0 = 53 'S' ``` 得到: ```text VMRPCS ``` 后续对主体做相应解码,也能直接看到大量有意义的字符串: ```text libUE4.so libanogs.so libanort.so /proc/self/maps /data/adb /data/adb/ksud pthread_mutex_trylock pthread_mutex_unlock strstr sscanf dl_iterate_phdr ... ``` 这里后来需要特别区分两个概念: ```text VMRPCS 文件层编码 ``` 和: ```text VM runtime opcode mapping ``` 并不是一回事。 前者当前样本涉及 `0xDA`;后者是 VM 初始化阶段单独生成的一张 opcode map,后文会继续说。 --- # 0x02 找到真正的 VM code section 解码以后也不能直接从头开始当 bytecode 反汇编。 继续跟 loader,可以看到内部有明确的 section directory。 每个 entry 固定 10 字节: ```c struct VMRPCSSection { uint16_t type; uint32_t offset; uint32_t size; }; ``` 即: ```text u16 type u32 offset u32 size ``` loader 会先检查: ```text offset + size <= payload_size ``` 然后根据 `type` 加载不同区域。 当前样本解析出来: ```text type 1: offset = 0x41D6 size = 0x33698 type 2: offset = 0x0028 size = 0x41AE type 3: offset = 0x0000 size = 0x0006 type 4: offset = 0x0042 size = 0x0002 type 5: offset = 0x0000 size = 0x1000 ``` 其中: ```text Type1 = VM bytecode Type2 = strings / data ``` 所以真正送给 VM 的 code 范围是: ```text decoded_payload[ 0x41D6 : 0x41D6 + 0x33698 ] ``` Type1 实际大小: ```text 0x33698 = 210584 bytes ``` Type2: ```text 0x41AE = 16814 bytes ``` 这一步做好以后,后面 opcode frequency、函数边界和 CFG 才有意义。 --- # 0x03 先看 `sub_3F80CC` VM 入口: ```asm 3F80CC SUB SP, SP, #0x1F0 ... 3F8108 MOV X28, X0 ``` 很快能看到: ```asm 3F8118 LDR W20, [X28,#0x38]! ... 3F812C LDR X8, [X28,#-8]! 3F813C LDR W11, [X8] 3F8148 CMP W11,#8 ... 3F8154 LDR X9, [X21,W9,UXTW#3] 3F8158 BR X9 ``` 第一反应很容易是: ```text table + BR X9 ↓ VM opcode dispatcher ``` 但继续分析后会发现这里主要属于 OLLVM flattening。 其结构更接近: ```text opaque calculation ↓ OLLVM state ↓ table @ 0x535030 ↓ BR X9 ``` 因此: ```text 0x535030 ``` 首先应该理解成: ```text OLLVM control-flow dispatcher table ``` 而不是 VM opcode handler table。 这也是整个分析过程中的第一个坑。 --- # 0x04 不完整去 OLLVM,直接追 VM 数据流 这里我没有选择先把整个 `sub_3F80CC` unflatten。 原因很简单: 我的目标不是把这个 native 函数 F5 得多漂亮,而是得到: ```text PC code_base opcode descriptor register file next PC ``` 只要这几样东西能够抽出来,就可以自己重新实现解释器。 在 flattened block 中可以看到: ```asm LDR X8, [ ... ] LDR X8, [X8] LDR X9, [X8,#8] ADD X11,X9,X27 LDRB W12,[X11,#1] LDRB W8, [X11,#2] LDRB W11,[X11,#3] ``` 很自然可以抽象成: ```c insn = code_base + X27; descriptor = insn[1]; arg1 = insn[2]; arg2 = insn[3]; ``` 接下来大量 handler 结尾都有: ```asm ADD W23,W23,#4 ``` 或: ```asm ADD W23,W23,#5 ADD W23,W23,#7 ADD W23,W23,#0xB ``` 最后汇合到: ```asm 403BD8: LDR X8,[X25] MOV W9,W23 STR X9,[X8,#0x130] ``` 于是可以先得到: ```text X27 ≈ current instruction offset W23 ≈ next PC state + 0x130 ≈ VM PC ``` 继续结合 loader 构造 VMState 的数据流,又能看到: ```text state + 0x130 = initial cursor / PC state + 0x138 = code limit / size ``` 这时 VM 主循环实际上已经露出来了: ```c while (state->pc < state->code_limit) { insn = code + state->pc; decode(insn); execute(insn); state->pc = next_pc; } ``` 虽然 native CFG 还是 OLLVM 状态机,但 VM 本身已经开始变得清晰。 --- # 0x05 register file handler 内还能反复看到: ```asm ADD X11,X9,X11,LSL#3 LDRB W11,[X11,#0x10] ``` 或: ```asm ADD X8,X9,X8,LSL#3 STRB W10,[X8,#0x10] ``` 其它 descriptor 分支则是: ```asm STRH W10,[X8,#0x10] STR W10,[X8,#0x10] STR X10,[X8,#0x10] ``` 所以可以确定 register addressing: ```c reg_addr = state_base + 0x10 + reg_index * 8; ``` 也就是: ```text 每个 VM register slot = 8 bytes ``` 所以这是一套 64 位 register VM。 不过这里后面还抓到一个很关键的细节: > 8 字节槽,不代表任何写操作都会覆盖全部 8 字节。 例如: ```text MOV.d ``` 只会覆盖低 32 位。 高 32 位保持原值。 这一点后来直接导致第一版 Clean VM 出现过错误,后面会讲。 --- # 0x06 静态恢复 OLLVM 间接跳转 `0x535030` 附近的 table 还有一个问题: 直接看文件,很多 entry 看起来是 0。 开始以为: ```text table 是 runtime 构造的? ``` 后来查 ELF relocation 才发现: 它通过: ```text R_AARCH64_RELATIVE ``` 在 loader 阶段填写实际地址。 因此可以直接解析 ELF relocation: ```text table index ↓ R_AARCH64_RELATIVE ↓ real basic block ``` 不需要运行目标。 第一版静态脚本就恢复出了大量: ```text logical opcode → handler entry ``` 例如: ```text OP00 -> 0x403958 OP01 -> 0x4039B8 OP02 -> 0x403A48 OP03 -> 0x403B0C OP04 -> 0x3F820C OP05 -> 0x3F82D0 OP06 -> 0x3F8458 OP07 -> 0x3F8720 OP08 -> 0x3F89F4 ... ``` 还发现几个 handler alias: ```text OP64 OP66 └─ same handler OP65 OP67 └─ same handler ``` 说明 96 个 logical slot 并不等于 96 个完全独立的 semantic implementation。 --- # 0x07 opcode 本身还有 runtime map 解释器初始化阶段: ```text 0x396D30 ``` 附近会生成一张 96-byte opcode map。 最后恢复出的逻辑是: ```text mode = program[0x174] seed = program[0x170] t = ((mode | 0xA0) ^ seed) & 0xFF if mode < 3 or t == 0: k = 0 else: k = t opcode_map[i] = i ^ k ``` 因此真正关系是: ```text raw_opcode = logical_slot ^ k ``` 反过来: ```text logical_slot = raw_opcode ^ k ``` 当前这份样本: ```text k = 0 ``` 所以: ```text raw opcode == logical opcode ``` 只是这个样本恰好如此。 这里也解决了前期一个认知问题: ```text 0xDA ``` 属于 VMRPCS 文件层编码; 而: ```text opcode XOR key k ``` 属于 VM runtime opcode mapping。 这两个不能混为一谈。 --- # 0x08 为什么不能只看 opcode handler 入口 分析过程中还出现过一种矛盾: 真实 bytecode 中某个 opcode 明显表现成 A 类语义,但是进入 dispatcher 后,handler entry 附近的 ARM64 却更像 B 类语义。 继续拆才发现实际结构是: ```text opcode ↓ handler entry ↓ descriptor decode ↓ descriptor jump table ↓ shared OLLVM blocks ↓ real semantic operation ``` 所以真正应该恢复的是: ```text (opcode, descriptor) ``` 而不是只看: ```text opcode ``` 当前真实脚本早期覆盖时就已经观察到: ```text 40 raw opcodes 105 (opcode, descriptor) combinations 9034 unique reachable VM PCs 0 instruction-boundary decode failures ``` 这也证明 decoder 的基本框架已经比较稳定。 --- # 0x09 指令格式 这个 VM 的基本 instruction layout 可以抽象为: ```text +0 opcode +1 descriptor +2 operand A +3 operand B / immediate... ``` descriptor 决定: ```text source mode source width destination width register/immediate ``` 寄存器宽度主要为: ```text 8 16 32 64 bit ``` immediate 则对应: ```text 1 2 4 8 bytes ``` 所以经常能看到 instruction size: ```text 4 5 7 11 bytes ``` 这正好和解释器中的: ```asm next_pc += 4 next_pc += 5 next_pc += 7 next_pc += 0xB ``` 完全对应。 到这一步,VM 已经可以稳定线性反汇编。 --- # 0x0A 一个真实的误判:OP07 这里专门说一个中间分析错过的 opcode。 早期分析 `OP07` 时,在它相关路径里看到: ```asm LDRSB LDRB STRB ``` 而且当时 descriptor 二级分发还没有完全理顺。 所以第一版判断是: ```text OP07 = indirect LOAD / STORE family ``` 这个判断后来被证明是错的。 重新从: ```text OP07 handler entry ``` 开始,沿正确 descriptor 分支一路跟到底后,可以看到: 1. source 只允许 register; 2. `mid` 控制 source 的 signed width; 3. source 会执行 sign extension; 4. 和 destination 当前值相乘; 5. 最终根据 `hi` 截断到 destination width。 所以真正语义是: ```text SMUL_EXT ``` 等价伪代码: ```c dst = truncate_to_dst_width( dst * sign_extend(src, src_width) ); ``` 其中: ```text descriptor low = 5 register source descriptor mid src signed width: 8 / 16 / 32 / 64 descriptor hi result width: 8 / 16 / 32 / 64 ``` 所以最初看到的 `LDRB/LDRSB` 实际上只是 operand extraction 的一部分,并不能代表最终 opcode 语义。 这也是后来恢复 ISA 时一直遵守的原则: ```text 不能: 看到几条 ARM64 ↓ 直接给 opcode 命名 而应该: handler CFG + descriptor path + 真实 bytecode + emulator execution ↓ 最终定性 ``` --- # 0x0B ISA 覆盖情况 最后确认: ```text opcode-map slots = 96 ``` 但当前 build 真正实现: ```text 69 ``` 剩下: ```text 27 ``` 属于保留或未实现 slot。 整数类基本包含: ```text MOV ADD SUB MUL DIV REM AND OR XOR SHIFT CMP SETcc JMP Jcc CALL CALL_REG RET PUSH_ARG ENTER_FRAME LEAVE_FRAME ``` 浮点也比较完整: ```text FADD FSUB FMUL FDIV FCMP FMIN FMAX FCVTZU FCVTZS UCVTF SCVTF ... ``` 条件码不止整数: ```text EQ HI HS LO LS NE GT GE LT LE ``` 还有浮点: ```text FUEQ FOEQ FOGT FOGE FOLT FOLE FUNE FONE FORD FUNO ``` 因此这并不是一套只为少量规则临时设计的小型 VM,而是一套比较完整的 register machine。 --- # 0x0C HOSTCALL 仅恢复 opcode 还不足以理解脚本。 真正和系统/native 环境交互的逻辑大量通过 HOSTCALL 完成。 最终可以大致分为三组: ```text low ID → Linux syscall 0x3xx → internal native service >= 0x500 → provider registry ``` 已经恢复出不少 service: ```text 0x35C REGISTER_VM_CALLBACK 0x359 VM_SLOT_GET 0x35A VM_SLOT_SET 0x36E memset 0x36F memcpy_checked 0x372 strlen 0x38C CALL_NATIVE_N 0x38D RESOLVE_SYMBOL 0x390 mincore 0x51C malloc 0x51E free 0x524 fopen 0x529 fclose 0x569 fgets ``` 还有序列化接口: ```text 0x367 SERIALIZER_SET_MODE 0x301 SERIALIZER_APPEND 0x302 SERIALIZER_FLUSH ``` `0x301` 的 type: ```text 1 = u8 2 = u16 3 = u32 4 = u64 5 = cstring ``` 其中整数采用 big-endian 写入内部 buffer。 于是: ```text PUSH_ARG value PUSH_ARG 3 HOSTCALL 0x301 ``` 可以提升成: ```c serializer.append_u32(value); ``` 而原来的: ```text "libc.so" "strstr" HOSTCALL 0x38D ``` 可以直接变成: ```c resolve_symbol("libc.so", "strstr"); ``` HOSTCALL 语义恢复以后,VM 汇编的可读性提升非常明显。 --- # 0x0D Clean VM Emulator ISA 表基本完成后,我没有直接开始做反编译器。 先重新写了一份 Clean VM。 原因是: > 静态看起来合理,不代表真实执行一定正确。 Clean VM 内部重新实现: ```text register file PC FLAGS stack/frame CALL stack integer ALU float ALU CMP/SETcc Jcc CALL CALL_REG RET HOSTCALL stub ``` HOSTCALL 运行在分析环境中: ```text 已知 libc/service → sandbox implementation 未知 external action → log / symbolic result ``` 原来的: ```text sub_3F80CC ``` 此时只作为: ```text reference implementation / oracle ``` 某条指令行为不一致时才回去继续看原始解释器。 --- # 0x0E Clean VM 抓到的一个语义错误 前面说过 VM register slot 是 8 字节。 第一版 Clean VM 中,我错误地把: ```text MOV.d ``` 理解成: ```c regs[dst] = (uint32_t)value; ``` 这样会顺便把高 32 位清零。 实际原始解释器做的是: ```text 只覆盖低 32 位 高 32 位保持 ``` 结果第一版 emulator 在某些路径下会得到非常大的假 HOSTCALL service ID。 重新检查 descriptor 和原始 handler 后,把 narrow write 改成 partial write: ```c regs[dst] = (regs[dst] & 0xFFFFFFFF00000000ULL) | (uint32_t)value; ``` 问题消失。 这个例子也说明为什么我觉得: ```text Clean VM ``` 比单纯继续静态看 opcode 更重要。 --- # 0x0F `0x6C93` 为什么一直不返回 批量跑 callback 时,曾经得到: ```text 31 / 32 callbacks 能够执行到 RET ``` 只有: ```text 0x6C93 ``` 一直触发 step limit。 开始怀疑: ```text 还有 opcode 没恢复? CALL_REG 有问题? HOSTCALL 模拟不完整? ``` 后来直接对它做 static CFG returnability analysis。 结果发现: ```text 0x6C93 没有任何可达 RET ``` 并且内部有两个闭环。 所以正确结论不是: ```text 31 成功 1 失败 ``` 而是: ```text 31 / 31 应返回 callback 全部正常 RET 1 persistent worker expected non-returning semantic gap = 0 unexpected VM error = 0 ``` 也就是说 `0x6C93` 本身就是设计为持续执行的 worker。 这个修正以后,针对当前样本的 Clean VM 执行语义基本闭环。 --- # 0x10 开始做反编译器 VM 能执行以后,下一个问题变成: > 如何把几百条 VM 指令自动还原成可读 C-like? 第一版 lifter 不读取打印出来的 assembly,而是直接从 bytecode 开始: ```text bytecode ↓ decoder ↓ basic blocks ↓ CFG ↓ symbolic VM-register propagation ↓ IR ``` 同时把: ```text SP FP LR PUSH_ARG HOSTCALL ``` 这一类 VM 层行为继续往高层折叠。 例如 `0x6C94`: 原始: ```text 19 VM instructions ``` 最后可以压成: ```c free(g_0470); g_0470 = 0; return; ``` 另一个 `0x6C63`: ```text 54 VM instructions ``` 最后: ```c ++g_16A0; serializer.set_mode(3); serializer.append_u32(g_16A0); serializer.append_u32(g_1608); serializer.append_u32(g_160C); serializer.append_u32(g_1610); serializer.append_u32(g_1614); serializer.flush(1); ``` 当时还拿 `0x6C6E` 做压力测试。 它有: ```text 592 VM instructions ``` 第一版 lifted block IR 大约: ```text 270 lines ``` 已经可以恢复: ```c tid = gettid(); sprintf(proc_path, "/proc/%d/comm", tid); fp = fopen(proc_path, "r"); if (fp) { fgets(comm, 0x1E, fp); fclose(fp); } len = strlen(comm); tail_len = len < 17 ? len : 16; strncpy( comm_tail, comm + len - tail_len, tail_len ); eglGetCurrentContext = resolve_symbol( "libEGL.so", "eglGetCurrentContext" ); ``` 并且自动恢复出: ```c strstr(path, "/libhwui.so"); strstr(path, "/libutils.so"); strstr(path, "/libc.so"); strstr(path, "/libEGL.so"); ``` 这时已经不是靠字符串猜业务含义,而是 VM 数据流真正被提升成了 C-like expression。 --- # 0x11 CFG Structuring 最初 lifted IR 仍然充满: ```text loc_xxx: goto loc_xxx; phi(...); ``` 所以继续实现: ```text dominator post-dominator natural loop detection if if/else while early return break merge / phi recovery ``` 早期还有: ```text 20 complex helpers ``` 需要 fallback。 其中不少并不是不可约 CFG,而只是结构器还不认识: ```text loop 内 early return 双层 loop 的 break 多条 error path 汇合到统一 cleanup tail ``` 逐渐补成通用 rule 后,最终达到: ```text 393 / 393 functions 393 / 393 zero fallback 0 residual phi_rXX ``` 所有已发现 VM 函数都能够进入结构化 C-like 输出。 --- # 0x12 函数发现:CALL 不是 basic block 函数发现阶段也踩过坑。 如果看到: ```text CALL target ``` 就把 target 当成当前函数的 CFG successor,那么多个函数会直接被错误拼在一起。 后面明确分成: ```text JMP / Jcc → intra-function CFG edge CALL → inter-function call edge ``` 重新扫描整个 Type1 后,最终发现: ```text 393 个标准 VM function prologue ``` 验证: ```text 393 / 393 独立解码成功 0 function boundary overlap 0 instruction-format error ``` Type1 总大小: ```text 210584 bytes ``` 其中函数指令覆盖: ```text 210192 bytes ``` 剩余: ```text 392 bytes ``` 而这: ```text 392 bytes ``` 恰好全部是: ```text 0x00 ``` 393 个函数之间刚好有: ```text 392 个 separator ``` 所以这时才可以比较有把握地说: > 当前 Type1 的函数边界已经完整切出来。 --- # 0x13 callback:从 32 修正到 33 / 34 早期从初始化入口出发统计时,一直认为: ```text 32 callbacks ``` 后来完整扫描: ```text REGISTER_VM_CALLBACK ``` 相关 registration 后,发现这个数字也需要修正。 最终是: ```text 33 unique callback entries 34 task registrations ``` 原因是: ```text VM entry 0x10479 ``` 被注册了两次: ```text task 0x6C57 task 0x6C60 ``` 所以: ```text unique callbacks = 33 registrations = 34 ``` 这也说明只从初始化入口递归 callgraph,不足以保证发现全部任务入口。 还要结合: ```text registration prologue scanning callback thunk indirect call ``` 一起做。 --- # 0x14 CALL_REG 普通: ```text CALL immediate_target ``` 比较简单。 真正麻烦的是: ```text CALL_REG rX ``` 目标可能来自: ```text constant stack local function argument object field runtime-resolved function pointer ``` 后面逐渐加入: ```text constant propagation SSA stack-local propagation caller/callee propagation ``` 当前样本最终达到: ```text 0 unresolved CALL_REG ``` 完整静态 VM callgraph: ```text 906 edges ``` 也就是说当前样本里能够静态解析的 indirect VM call 已经全部解析完成。 --- # 0x15 VM register 去除与 SSA 即使控制流恢复完,如果最后还是: ```c r15 = foo(); r16 = r15; r17 = r16 + 8; ``` 可读性仍然很差。 所以后面又做了一层 VM-register SSA。 CALL/HOSTCALL 等返回值不再长期绑定: ```text r15 ``` 而是先生成: ```text tmp_xxxxx ``` 再通过: ```text single-use inline alias propagation local promotion dead result elimination semantic rename ``` 不断往高层提升。 期间还抓到过一个 cleanup bug: 如果临时值在某个 branch 定义,在 merge block 才使用,只根据局部 block lifetime 判断,就可能错误地删掉 definition。 后来 SSA cleanup 改成 whole-function def/use analysis。 最终: ```text physical VM rN references = 0 ``` 也就是说最终 C-like 中已经不再暴露: ```text r15 r16 r17 ... ``` 这样的 VM physical register。 --- # 0x16 Stack Object / Struct Recovery VM register 清掉以后,新的主要噪声变成: ```c *(uint64_t *)(fp + 0x470) *(uint32_t *)(fp + 0x478) *(uint64_t *)(fp + 0x480) ``` 从机器语义角度这是正确的。 但显然: ```text fp + 0x470 fp + 0x478 fp + 0x480 ``` 可能属于同一个 stack object。 于是后期重点从: ```text VM semantics ``` 转到: ```text local object recovery struct recovery type propagation ``` 当前已经能识别多种对象: ```text /proc/self/maps parser state CPU affinity mask u64 pair u64 triple fixed record array mixed-width object overlay / union stack buffer ``` 当前样本中: ```text 37 functions 命中 stack object recovery 90 stack buffers / aliases 597 fp+offset expressions 被重写 ``` --- # 0x17 跨函数类型传播不能贪 类型恢复后面也出现过过度推断。 例如某个 callsite: ```c foo(&triple); ``` 看起来似乎可以推: ```c foo(VmU64Triple *arg1); ``` 但如果另一个调用点实际是: ```c foo(&triple.second); ``` 那么: ```text &triple.second ``` 显然不是: ```text VmU64Triple* ``` 所以现在跨函数类型传播使用的是比较严格的规则: > 同一 callee 参数的全部已观察调用点,必须给出一致的强类型证据,才允许提升。 允许: ```text &pair &pair NULL ``` 但: ```text &pair unknown ``` 不提升。 同样: ```text &triple &triple.second ``` 也不会提升成: ```text VmU64Triple* ``` 当前最终保留下来的严格跨函数 pointer/structure type propagation 为: ```text 12 ``` 同时: ```text 309 functions 推导出参数 174 functions 推导出返回值 182 pointer/string parameters ``` 这里我的原则是: > 宁愿保留 `uint64_t arg1`,也不要得到一个很漂亮但错误的 `MyStruct *ctx`。 --- # 0x18 一个实际 callback:`0x6C99` 当 HOSTCALL、CFG 和数据流都恢复以后,业务逻辑本身就没有那么神秘了。 例如: ```text 0x6C99 ``` 会打开: ```text /proc/self/maps ``` 然后解析: ```text start-end permissions pathname ``` 并检查若干 mapping 特征: ```text shadowhook-enter rwxp anon:LMA ``` 后续还会使用: ```text process_vm_readv ``` 读取相应映射内存,整理异常 mapping 记录,再通过 serializer 提交。 早期 HOSTCALL 没恢复时,只能看到: ```c hostcall_0x373(...); hostcall_0x10e(...); ``` 后来可以直接变成: ```c strstr(...); process_vm_readv(...); ``` 所以对这套 VM 来说: ```text HOSTCALL ABI recovery ``` 和: ```text ISA recovery ``` 几乎同样重要。 --- # 0x19 最终结果 当前完整样本最终状态: ```text VM functions 393 / 393 zero fallback 393 / 393 callbacks 33 registered tasks 34 static VM call edges 906 unresolved CALL_REG 0 ``` C-like cleanup 层: ```text physical VM rN refs 0 local_x refs 2377 ``` 同时已经进行了: ```text SSA tmp → local SSA alias rewrite single-use SSA inline dead return temp elimination semantic SSA rename local semantic rename parameter semantic rename result-slot recovery typed dereference normalization ``` 目前: ```text 393 / 393 functions ``` 全部已经进入结构化 C-like 输出。 对于当前研究用途来说,VM 的机器层基本已经透明。 --- # 0x1A 工具结构 最后整个工具大致拆成: ```text MRPCS / VMRPCS │ ▼ ┌─────────────┐ │ Parser │ └──────┬──────┘ │ ▼ Section Loader │ ▼ ┌─────────────┐ │ Backend │ │ mvm_v1 │ └──────┬──────┘ │ ┌───────────┼───────────┐ │ │ │ ▼ ▼ ▼ Decoder HOSTCALL ABI │ ▼ Disassembler │ ▼ Function Discovery │ ▼ CFG │ ▼ VM Lifter │ ▼ SSA / Dataflow │ ▼ Structurer │ ▼ Type / Object Recovery │ ▼ C-like Output ``` VM-specific 内容尽量留在 backend: ```text section layout opcode map descriptor ISA HOSTCALL ABI callback registration ABI ``` 而这些部分尽量通用: ```text function discovery CFG dominator SSA dataflow structurer type propagation C-like emitter ``` 这样以后再遇到同系列的新 VM build,如果主要只是: ```text opcode descriptor HOSTCALL ``` 发生变化,就不必把整个反编译器重新写一次。 --- # 0x1B 几点经验 ## 1. 有 OLLVM,不代表第一步必须完整去混淆 对于 VM interpreter,更值得优先找的是: ```text PC code_base opcode descriptor register next PC ``` 只要这几个数据流还在,就可以绕着 flattening 工作。 --- ## 2. 间接跳转表不一定是 VM dispatcher 本例: ```text 0x535030 ``` 一开始很容易误判成 opcode table。 实际上首先是 OLLVM dispatcher。 --- ## 3. opcode 名字不要下得太早 `OP07` 就是一个典型反例。 早期: ```text indirect LOAD/STORE ``` 最终: ```text SMUL_EXT ``` 错误来自: ```text 把 operand extraction 误当成了 opcode semantic operation ``` --- ## 4. 最好自己实现一次 VM 只有静态分析时,经常只能说: ```text 这个 opcode 大概率是 XXX ``` 有了 clean emulator 后,可以直接验证: ```text 真实 bytecode 是否真的能按照当前语义执行完整路径 ``` 这是完全不同的可信度。 --- ## 5. 函数发现不要把 CALL 当普通 branch ```text JMP/Jcc ``` 和: ```text CALL ``` 如果边界没有分开,整个 function inventory 都会错。 --- ## 6. 保留错误推断比隐藏错误更有价值 整个过程中至少出现过: ```text OP07 32 callbacks 0x6C93 跨函数结构类型 ``` 等多次修正。 这些并不是“研究质量差”,反而是逆向里最正常的过程。 重要的是: ```text 错误假设 ↓ 新的证据 ↓ 推翻 ↓ 重新验证 ``` --- # 0x1C 从“给人看”到“给 AI 分析” 做到最后以后,我对反编译器目标也有了一点变化。 如果主要给人阅读,那么肯定希望最终都是: ```c MappingContext *ctx; MappingRecord *record; size_t length; ``` 但如果后续大规模行为分析交给 AI,那么真正重要的是: ```text function boundaries 正确 CFG 正确 callgraph 正确 CALL_REG 正确 HOSTCALL 有语义 string xref 完整 global read/write 正确 type evidence 稳定 VM PC ↔ C-like mapping 稳定 ``` AI 并不会因为一个变量仍然叫: ```c local_68 ``` 就完全理解不了代码。 真正会严重影响分析的是: ```text SSA value 错误合并 branch merge definition 被删 CALL_REG target 丢失 struct base 判断错误 函数边界错误 ``` 因此工具后期的目标已经从: ```text MVM → 漂亮 C ``` 慢慢变成: ```text MVM ↓ Structured Program Representation ↓ C-like ↓ Callgraph / Types / Xrefs ↓ AI Analysis Dataset ``` --- # 0x1D 总结 最初面对的是: ```text stripped ARM64 ELF + OLLVM + 未知 VMRPCS + 未知 VM ISA + 未知 descriptor + 未知 HOSTCALL ``` 最终得到: ```text VMRPCS Parser 210584-byte Type1 VM code 69 / 96 implemented opcode slots Clean VM Emulator 393 VM functions 33 unique callbacks 34 task registrations 906 static VM call edges 0 unresolved CALL_REG 0 residual phi 0 physical VM register refs 393 / 393 structured C-like functions ``` 当前报告中,该样本已经完整进入 C-like 输出。 回头看整个过程,研究对象实际上经历了三次变化。 一开始的问题是: ```text sub_3F80CC 到底在干什么? ``` 后来变成: ```text 这颗 VM CPU 到底是怎么工作的? ``` 再后来则变成: ```text 能不能直接写一个它的反编译器? ``` 到了最后,原来隐藏在: ```text OLLVM + 自定义 VM ``` 后面的程序,又重新变成了普通的: ```text function basic block callgraph condition loop type struct string syscall ``` 这次分析我觉得最有效的一条路线,可以总结为: ```text 先确定文件边界 ↓ 找到真正 VM code ↓ 绕开 OLLVM dispatcher ↓ 恢复 VM state ↓ 恢复 PC / register / descriptor ↓ 恢复 ISA ↓ 自己实现 VM ↓ 真实 bytecode 验证 ↓ 函数发现 ↓ CFG / IR ↓ 静态反编译 ↓ 类型与结构恢复 ``` 简单说: > **先把 VM 当成一颗 CPU 逆,再把 VM bytecode 当成普通程序逆。** 本文先记录到这里。
登录后可查看完整内容
冰与火的战歌:Windows内核攻防实战高级班!从零到实战,融合AI与Windows内核攻防全技术栈,打造具备自动化能力的内核开发高手。
最后于
8小时前 被AE__编辑 ,原因:
#VM保护
上传的附件:
mrpcs_a_v_decompiled.zip
(304.55kb,23次下载)
收藏
・
1
点赞
・
3
打赏
分享
分享到微信
分享到QQ
分享到微博
赞赏记录
参与人
雪币
留言
时间
git_51377wwwyyy964
感谢你的积极参与,期待更多精彩内容!
3小时前
孤独的街
感谢你的贡献,论坛因你而更加精彩!
8小时前
伟叔叔
这个讨论对我很有帮助,谢谢!
13小时前
查看更多
赞赏
×
1 雪花
5 雪花
10 雪花
20 雪花
50 雪花
80 雪花
100 雪花
150 雪花
200 雪花
支付方式:
微信支付
赞赏留言:
快捷留言
感谢分享~
精品文章~
原创内容~
精彩转帖~
助人为乐~
感谢分享~
最新回复
(
2
)
XCicada
雪 币:
3085
活跃值:
(2690)
能力值:
( LV6,RANK:80 )
在线值:
发帖
3
回帖
324
粉丝
101
关注
私信
XCicada
2
2
楼
学习
4小时前
0
淡然他徒弟
雪 币:
5616
活跃值:
(7303)
能力值:
( LV10,RANK:160 )
在线值:
发帖
23
回帖
298
粉丝
124
关注
私信
淡然他徒弟
1
3
楼
mark
1小时前
0
游客
登录
|
注册
方可回帖
回帖
表情
雪币赚取及消费
高级回复
返回
AE__
1
1
发帖
0
回帖
40
RANK
关注
私信
他的文章
[原创]ACE反作弊 MVM 的分析与还原
491
关于我们
联系我们
企业服务
看雪公众号
专注于PC、移动、智能设备安全研究及逆向工程的开发者社区
谁下载
×
kanxue
huangyalei
风间仁
asd
坚持到底
顽劣
fjqisba
kingking888
Istaroth
X-Blades
啊你好哇123
2beNo2
wx_0.0_522
mb_gznromrh
mb_ldbucrik
mb_eizetlni
AE__
git_51377wwwyyy964
看原图
赞赏
×
雪币:
+
留言:
快捷留言
为你点赞!
返回
顶部