|
|
[求助]这样的IDT HOOK为什么在多线程运行的情况下蓝屏?附上代码和DUMP!!!
问题还是没有解决啊,UNEXPECTED_KERNEL_MODE_TRAP (7f) This means a trap occurred in kernel mode, and it's a trap of a kind that the kernel isn't allowed to have/catch (bound trap) or that is always instant death (double fault). The first number in the bugcheck params is the number of the trap (8 = double fault, etc) Consult an Intel x86 family manual to learn more about what these traps are. Here is a *portion* of those codes: If kv shows a taskGate use .tss on the part before the colon, then kv. Else if kv shows a trapframe use .trap on that value Else .trap on the appropriate frame will show where the trap was taken (on x86, this will be the ebp that goes with the procedure KiTrap) Endif kb will then show the corrected stack. Arguments: Arg1: 0000000d, EXCEPTION_GP_FAULT Arg2: 00000000 Arg3: 00000000 Arg4: 00000000 是什么意思呢? |
|
|
|
|
|
[求助]初级问题,怎样知道函数原形,如ZwQuerySystemInformation
没法通过代码分析其原形吗??? |
|
|
[求助]在驱动中使用NtSuspendThread,为什么加载驱动时提示 error(127) 找不到指定的程序?
我只要把NTSTATUS NtSuspendThread( IN HANDLE ThreadHandle, OUT PULONG PreviousSuspendCount OPTIONAL ); NtSuspendThread(hThread[i],&PreCount[i]); 去掉,加载就能成功! 为什么啊 |
|
|
[求助]在驱动中使用NtSuspendThread,为什么加载驱动时提示 error(127) 找不到指定的程序?
就是我的驱动程序中用到了 NTSTATUS NtSuspendThread( IN HANDLE ThreadHandle, OUT PULONG PreviousSuspendCount OPTIONAL ); NtSuspendThread(hThread[i],&PreCount[i]); 在用DRIVERMONITOR加载驱动的时个,出现现error(127) 找不到指定的程序 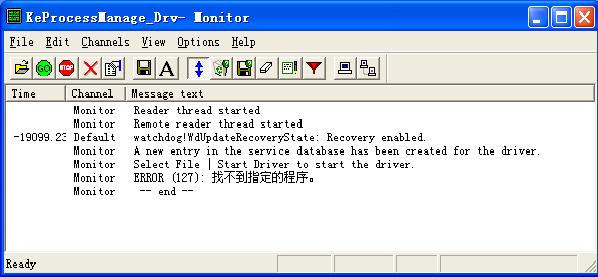 |
|
|
[求助]内核模式PsCreateSystemThread()创建的线程如何终止?
会了,结帖了,哈哈 |
|
|
|
|
|
[求助]这段汇编代码谁给详细解释一下,我不会算地址偏移!
不好意思,能不能再详细说一点儿,我还是不太明白,汇编基础太差 |
|
|
[求助]这样的IDT HOOK为什么在多线程运行的情况下蓝屏?附上代码和DUMP!!!
如果是USB键盘的话,HOOK不起作用,就不蓝屏,我是在VMWARE上调的,键盘IDT为0x93,这种情况就蓝屏了 |
|
|
[求助]这样的IDT HOOK为什么在多线程运行的情况下蓝屏?附上代码和DUMP!!!
运行EXE后,加载驱动,再按键盘就蓝了! |
|
|
[求助]这样的IDT HOOK为什么在多线程运行的情况下蓝屏?附上代码和DUMP!!!
我在任意的一下进程中,新建一个线程,如 WORD WINAPI ThreadProc1( LPVOID lpParam ) { while(1) { } return 1; } hThread[1] = CreateThread( NULL, // default security attributes 0, // use default stack size ThreadProc1, // thread function NULL, // argument to thread function 0, // use default creation flags &dwThreadId[1]); // returns the thread identifier 这样再按键盘就会出现蓝屏,DUMP如下 kd> !analyze -v ******************************************************************************* * * * Bugcheck Analysis * * * ******************************************************************************* UNEXPECTED_KERNEL_MODE_TRAP (7f) This means a trap occurred in kernel mode, and it's a trap of a kind that the kernel isn't allowed to have/catch (bound trap) or that is always instant death (double fault). The first number in the bugcheck params is the number of the trap (8 = double fault, etc) Consult an Intel x86 family manual to learn more about what these traps are. Here is a *portion* of those codes: If kv shows a taskGate use .tss on the part before the colon, then kv. Else if kv shows a trapframe use .trap on that value Else .trap on the appropriate frame will show where the trap was taken (on x86, this will be the ebp that goes with the procedure KiTrap) Endif kb will then show the corrected stack. Arguments: Arg1: 0000000d, EXCEPTION_GP_FAULT Arg2: 00000000 Arg3: 00000000 Arg4: 00000000 Debugging Details: ------------------ ************************************************************************* *** *** *** *** *** Your debugger is not using the correct symbols *** *** *** *** In order for this command to work properly, your symbol path *** *** must point to .pdb files that have full type information. *** *** *** *** Certain .pdb files (such as the public OS symbols) do not *** *** contain the required information. Contact the group that *** *** provided you with these symbols if you need this command to *** *** work. *** *** *** *** Type referenced: kernel32!pNlsUserInfo *** *** *** ************************************************************************* ************************************************************************* *** *** *** *** *** Your debugger is not using the correct symbols *** *** *** *** In order for this command to work properly, your symbol path *** *** must point to .pdb files that have full type information. *** *** *** *** Certain .pdb files (such as the public OS symbols) do not *** *** contain the required information. Contact the group that *** *** provided you with these symbols if you need this command to *** *** work. *** *** *** *** Type referenced: kernel32!pNlsUserInfo *** *** *** ************************************************************************* BUGCHECK_STR: 0x7f_d DEFAULT_BUCKET_ID: DRIVER_FAULT PROCESS_NAME: MultiThreadTest LAST_CONTROL_TRANSFER: from 804f8b9d to 80528bdc STACK_TEXT: ef40b8a4 804f8b9d 00000003 ef40bc00 00000000 nt!RtlpBreakWithStatusInstruction ef40b8f0 804f978a 00000003 80538f15 02480248 nt!KiBugCheckDebugBreak+0x19 ef40bcd0 80541dff 0000007f 0000000d 00000000 nt!KeBugCheck2+0x574 ef40bcd0 80538f15 0000007f 0000000d 00000000 nt!KiSystemFatalException+0xf ef40bd8c f898d393 f898f1b4 00000000 1b70c81e nt!_SEH_prolog+0x5 WARNING: Stack unwind information not available. Following frames may be wrong. ef40bda0 f898d3a0 00000002 0064ffb4 02480248 HelloDDK+0x1393 ef40bddc 80542dd2 efcd893d efcd7fc0 00000000 HelloDDK+0x13a0 ef40bde0 efcd893c efcd7fc0 00000000 0000027f nt!KiThreadStartup+0x16 ef40bdf0 02480000 00000000 00000000 00000000 rdbss!RxInitializeContext+0x132 ef40be04 00000000 02480248 02480248 02480248 0x2480000 STACK_COMMAND: kb FOLLOWUP_IP: HelloDDK+1393 f898d393 83c40c add esp,0Ch SYMBOL_STACK_INDEX: 5 SYMBOL_NAME: HelloDDK+1393 FOLLOWUP_NAME: MachineOwner MODULE_NAME: HelloDDK IMAGE_NAME: HelloDDK.sys DEBUG_FLR_IMAGE_TIMESTAMP: 49d1da6b FAILURE_BUCKET_ID: 0x7f_d_HelloDDK+1393 BUCKET_ID: 0x7f_d_HelloDDK+1393 Followup: MachineOwner --------- 请问这是为什么呢? |
|
|
[求助]这样的IDT HOOK为什么在多线程运行的情况下蓝屏?
附上DUMP kd> !analyze -v ******************************************************************************* * * * Bugcheck Analysis * * * ******************************************************************************* UNEXPECTED_KERNEL_MODE_TRAP (7f) This means a trap occurred in kernel mode, and it's a trap of a kind that the kernel isn't allowed to have/catch (bound trap) or that is always instant death (double fault). The first number in the bugcheck params is the number of the trap (8 = double fault, etc) Consult an Intel x86 family manual to learn more about what these traps are. Here is a *portion* of those codes: If kv shows a taskGate use .tss on the part before the colon, then kv. Else if kv shows a trapframe use .trap on that value Else .trap on the appropriate frame will show where the trap was taken (on x86, this will be the ebp that goes with the procedure KiTrap) Endif kb will then show the corrected stack. Arguments: Arg1: 0000000d, EXCEPTION_GP_FAULT Arg2: 00000000 Arg3: 00000000 Arg4: 00000000 Debugging Details: ------------------ ************************************************************************* *** *** *** *** *** Your debugger is not using the correct symbols *** *** *** *** In order for this command to work properly, your symbol path *** *** must point to .pdb files that have full type information. *** *** *** *** Certain .pdb files (such as the public OS symbols) do not *** *** contain the required information. Contact the group that *** *** provided you with these symbols if you need this command to *** *** work. *** *** *** *** Type referenced: kernel32!pNlsUserInfo *** *** *** ************************************************************************* ************************************************************************* *** *** *** *** *** Your debugger is not using the correct symbols *** *** *** *** In order for this command to work properly, your symbol path *** *** must point to .pdb files that have full type information. *** *** *** *** Certain .pdb files (such as the public OS symbols) do not *** *** contain the required information. Contact the group that *** *** provided you with these symbols if you need this command to *** *** work. *** *** *** *** Type referenced: kernel32!pNlsUserInfo *** *** *** ************************************************************************* BUGCHECK_STR: 0x7f_d DEFAULT_BUCKET_ID: DRIVER_FAULT PROCESS_NAME: MultiThreadTest LAST_CONTROL_TRANSFER: from 804f8b9d to 80528bdc STACK_TEXT: ef6de8a8 804f8b9d 00000003 ef6dec04 00000000 nt!RtlpBreakWithStatusInstruction ef6de8f4 804f978a 00000003 80538f15 02480248 nt!KiBugCheckDebugBreak+0x19 ef6decd4 80541dff 0000007f 0000000d 00000000 nt!KeBugCheck2+0x574 ef6decd4 80538f15 0000007f 0000000d 00000000 nt!KiSystemFatalException+0xf ef6ded90 f895d38c f895f1b4 16fefd3b 0054ffb4 nt!_SEH_prolog+0x5 WARNING: Stack unwind information not available. Following frames may be wrong. ef6deda0 f895d399 00000002 0054ffb4 02480248 HelloDDK+0x138c ef6deddc 80542dd2 f8312b85 82030fc8 00000000 HelloDDK+0x1399 ef6dede0 f8312b84 82030fc8 00000000 0000027f nt!KiThreadStartup+0x16 ef6dede4 82030fc8 00000000 0000027f 02480000 NDIS!___PchSym_+0xc ef6dede8 00000000 0000027f 02480000 00000000 0x82030fc8 STACK_COMMAND: kb FOLLOWUP_IP: HelloDDK+138c f895d38c 83c408 add esp,8 SYMBOL_STACK_INDEX: 5 SYMBOL_NAME: HelloDDK+138c FOLLOWUP_NAME: MachineOwner MODULE_NAME: HelloDDK IMAGE_NAME: HelloDDK.sys DEBUG_FLR_IMAGE_TIMESTAMP: 49d1ce2a FAILURE_BUCKET_ID: 0x7f_d_HelloDDK+138c BUCKET_ID: 0x7f_d_HelloDDK+138c Followup: MachineOwner --------- |

操作理由
RANk
{{ user_info.golds == '' ? 0 : user_info.golds }}
雪币
{{ experience }}
课程经验
{{ score }}
学习收益
{{study_duration_fmt}}
学习时长
基本信息
荣誉称号:
{{ honorary_title }}
勋章
兑换勋章

证书
证书查询 >
能力值